Mobile App – My Stats
Monitoring Your
Business in the BNTouch Mobile App
While working with partners and
communicating with mortgage clients is vital to your business, sometimes you
need to take a step back and review your own performance. In the BNTouch Mobile
App, your most important business statistics are always available when you
first log in. Whether you want to compare recent months and years to previous
ones, keep track of which lead sources are providing the most bang for their
buck, or monitoring your conversion of leads to funded transactions, you can
always check on your business in the “My Stats” section of your app.
When you first log into the BNTouch app, the
“My Stats” screen will open by default. If you are coming back to the app after
using your mobile device for other purposes, you will be returned to whatever
section of the CRM you were accessing when you left. You can always open this
section later by swiping from left to right to open the menu, then tapping “My
Stats”.

General
Statistics
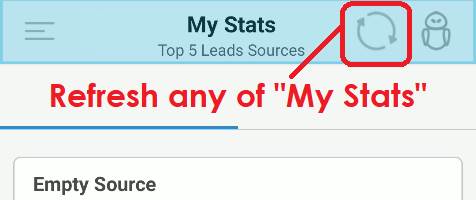
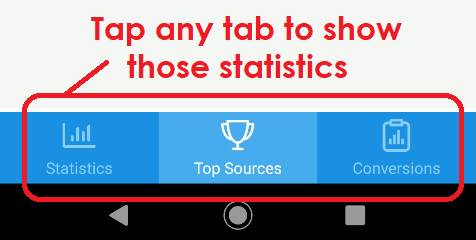
The “My Stats” part of your app is
separated into three sections that you can navigate between using the icons at
the bottom of your screen. You can also update the information shown in any of
these sub-sections by tapping the “Refresh” icon in the upper-right corner of
the screen.
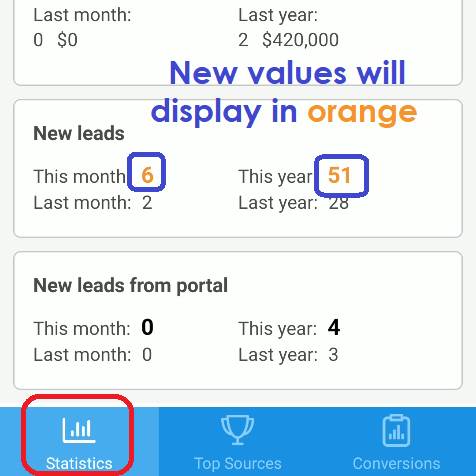
By default, the “Statistics” screen will
show when you first open “My Stats”. This page lets you compare the current and
previous month and year in several ways, with recent values marked in orange
and previous values in black. For “Funded Loans” and “Cancelled Loans”, you can
see the number of that type of loan as well as the total value of those loans
in parentheses to the right.
Below, you can also see how many new
leads you have collected via all sources and specifically through Loan
and Partner Portal sites.
Top Sources
Breakdown
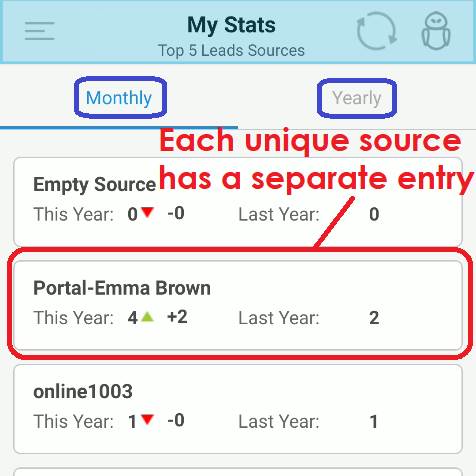
The second section of “My Stats”, “Top
Sources”, lets you see exactly where each of your leads are coming from and
which sources are performing the best. At the top of the screen, you can use
the “Monthly” and “Yearly” tabs to see how your lead sources compare during
those times.
Below, a separate entry will appear in
the list for each unique source that generated at least one lead during that
period. These can include those you enter yourself in the CRM, leads referred
to you by clients and partners via portal sites, referrals from other
collection points, entries from the BNTouch Website form, the online 1003 loan
application, and more.
Each unique source will display how many
leads it generated in the chosen time period, how many
more or less that is from the previous month or year, and the number of leads
that source collected in the previous time period for comparison. Red and green
arrows will indicate sources that have been performing better or worse during
the current period compared to previous date ranges.
Lead Conversion
Graph
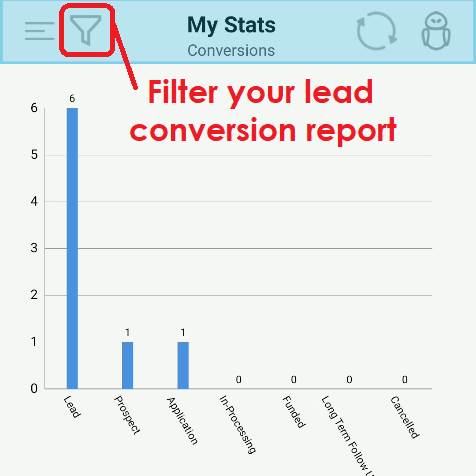
The final section of “My Stats” details
the progression of your leads through the marketing pipeline. In the
“Conversions” section, you will see a bar graph that displays the number of
mortgage records you have for each stage in the pipeline, starting with “Lead”
and progressing through “Prospect”, “Application”, and “In-Processing” before
hopefully reaching “Funded” status. “Long-term Follow Up” and “Cancelled” loans
will also be tallied here.
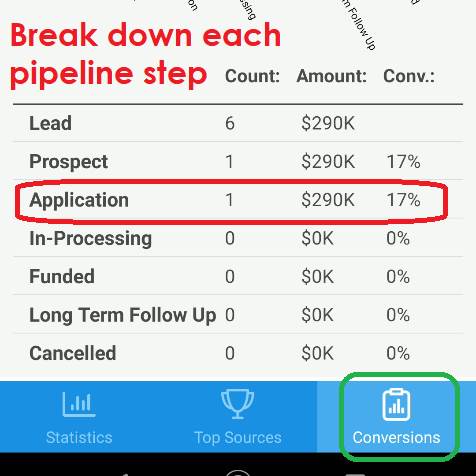
Below, you can view each marketing stage
along with a count of records in that stage, the total value of loans in that
stage, and the conversion rate from the previous stage.
This section of the “My Stats” screen can
also be filtered to provide a more detailed breakdown of your lead conversion.
When you tap the “Filter” icon in the upper-left corner of the screen, you can
restrict the statistics displayed by a specific source or within a particular
date range. You can also choose whether you want the bar graph to tally the
“Count” of unique records for each stage or the total “Amount” of loans in the
stage. Lastly, you can enter search terms in the “Keyword” box to only show
matching values. When you tap “Apply”, the conversions chart will update with
your new filter settings.
Want to Learn More?