Dashboard – Custom
Using the Custom
Sub-Tab in your Dashboard
Your BNTouch Dashboard is organized into
several sub-tabs, each containing useful tools and information.
The “Custom” sub-tab, unlike other
options in your Dashboard, can be configured to show whatever information is
more relevant to you and your business. Where other sub-tabs will have fixed
panels with consistent information for each CRM user, the “Custom” sub-tab will
be specific to each user’s Dashboard. You can find exactly what information you
want to see and hide anything that isn’t relevant.
Configuring Your
Custom Dashboard
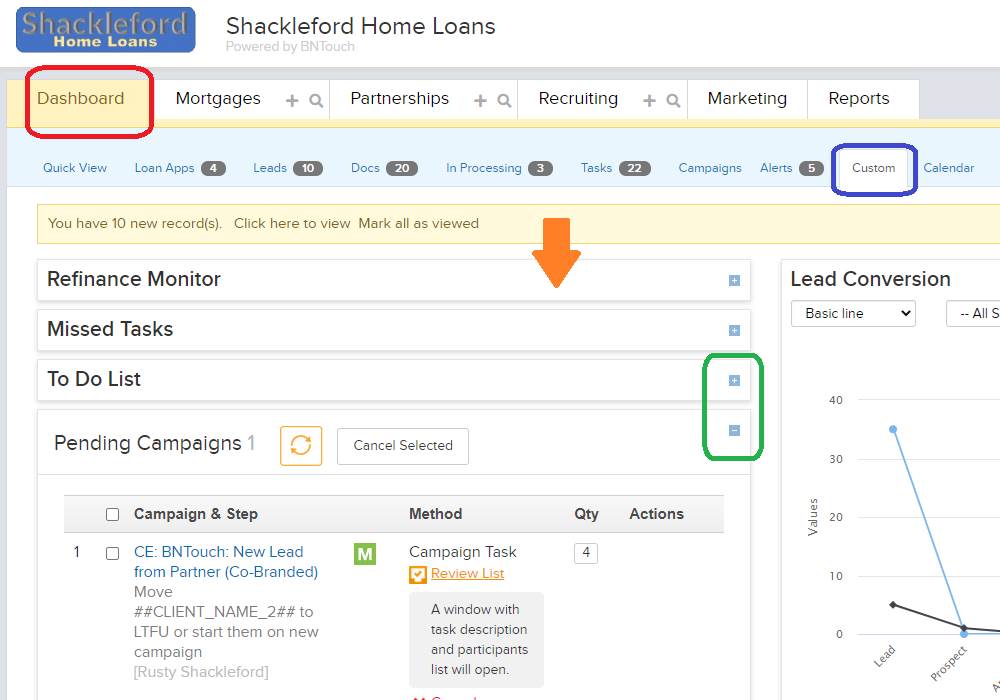
When you open the “Custom” sub-tab, you
will see several contained panels arrayed below. At the top of the page, you
will always see an alert for any new records that have been added to your
database. You can click the links in this banner to either view these new
records or mark them all as “Viewed”.
Each panel below will have a white bar at
the top. You can grab and hold this title bar with your mouse, then drag it
around the screen to reposition it on your Dashboard. This way, you can put
panels with important information at the top of the page.
To the left, you will see the title of
that panel, including everything from “Missed Tasks” and “Upcoming Birthdays”
to a “Lead Conversion” summary and “RSS Viewer” for your news. To the right,
you will see a small blue icon. You can click this icon to minimize a panel
into its title bar or expand it again. This allows you to hide panels that
aren’t important to you and display those that are.
Unique Custom
Panels
The majority of the panels available in the “Custom” Sub-tab are those that are
featured elsewhere in the Dashboard. You can learn more about each of these
panels in the corresponding “Dashboard” tab manual articles.
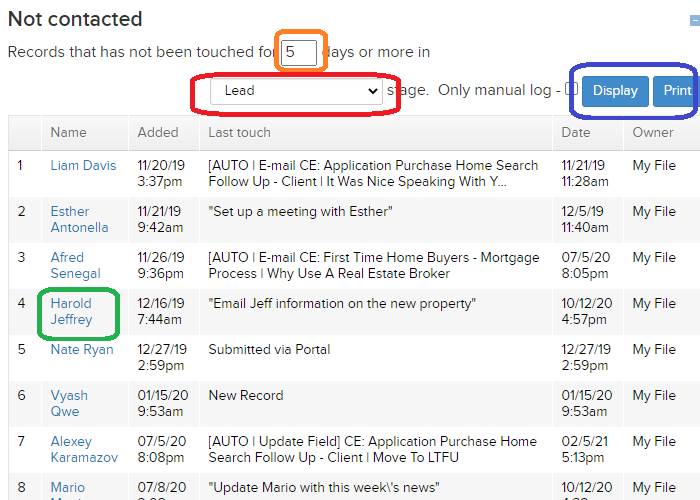
Some panels, however, are unique to this
“Custom” Sub-tab. The first is the “Not Contacted” panel. This list will show
you client records that you haven’t accessed in a number of
days specified in the box at the top of the panel. The last tracker event made
for each record will show below, along with the date the record was added, the
date it was last opened, and a link to the client’s record.
You can also narrow the list by specific
marketing sequence pipeline status using the drop-down menu. The list can be
updated with your current settings or printed using the buttons in the
upper-right corner.
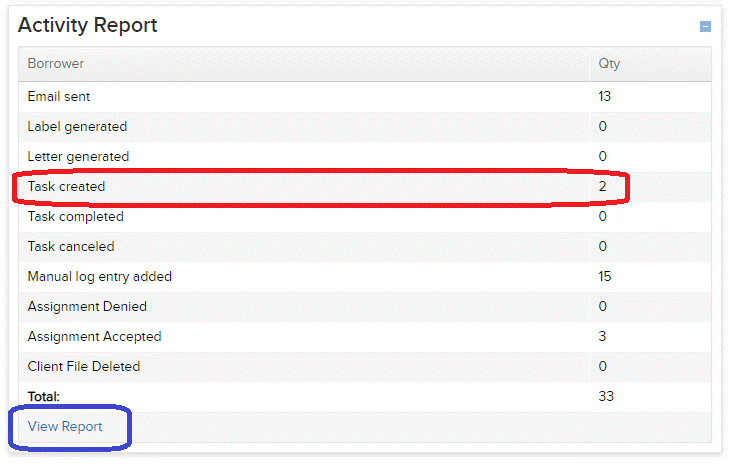
The “Activity Panel” panel will show a
summary of actions you have taken today. You can view a more detailed report of
tracker events for your records by clicking the “Full Report” link below.
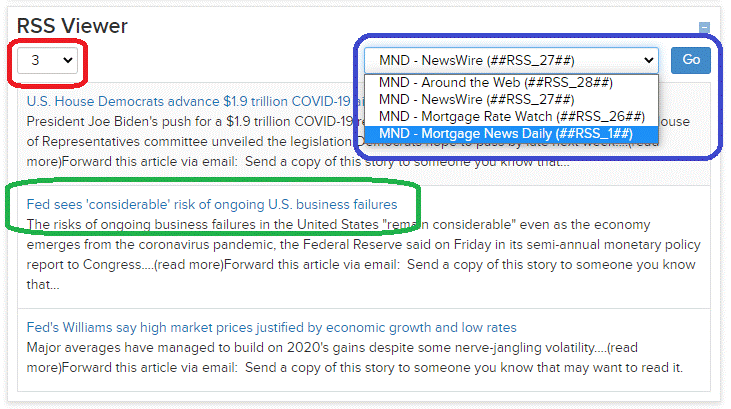
Lastly, you can review the latest
mortgage news in the “RSS Viewer” panel. Here, you can choose how many stories
you want to see, what RSS Feed source you want to read, and click “Go” to show
a list of matching articles. You can read a snippet of the article here or
click the blue headline link to access the full story.
Want to Learn More?
